System Monitoring System
Technology Stack List
It is a monitoring system based on Nightingale secondary development. On the original basis, it adds monitoring instructions and focuses on open source alarms.
It has built-in alarm rules, indicator descriptions, dashboards and other functions for various middleware and databases, which can be used out of the box. In addition, it can also be integrated with common data collectors such as Categraf, Telegraf, Datadog-agent, and various exporters. Supports alarms for indicators and logs. A set of rules can be applied to multiple data sources. In addition, it also supports suppression, mute, subscription, multiple notification media, and event re-marking. From business, to application, infrastructure; from physical machines, network equipment, to containers, Kubernetes; from indicators, to logs, link tracking, only one monitoring system platform is needed, which is ready to use out of the box.
- Functional features
- 1. Connect to multiple time series libraries to achieve unified monitoring and alarm management: Time series libraries that support docking include Prometheus, VictoriaMetrics, Thanos, Mimir, M3DB, TDengine, etc.
- 2. Connect to log libraries to achieve monitoring and alarm for logs: Log libraries that support docking include ElasticSearch, Loki, etc.
- 3. Professional alarm capabilities: Built-in support for multiple alarm rules, can be extended to support common notification media, support alarm shielding/suppression/subscription/self-healing, and alarm event management.
- 4. High-performance visualization engine: Supports multiple chart styles, built-in many Dashboard templates, and can also be imported into Grafana Template, ready to use, open source agreement business-friendly.
- 5. Support common collectors: support Categraf, Telegraf, Grafana-agent, Datadog-agent, various Exporters as collectors, there is no data that cannot be monitored.
Screenshot demonstration
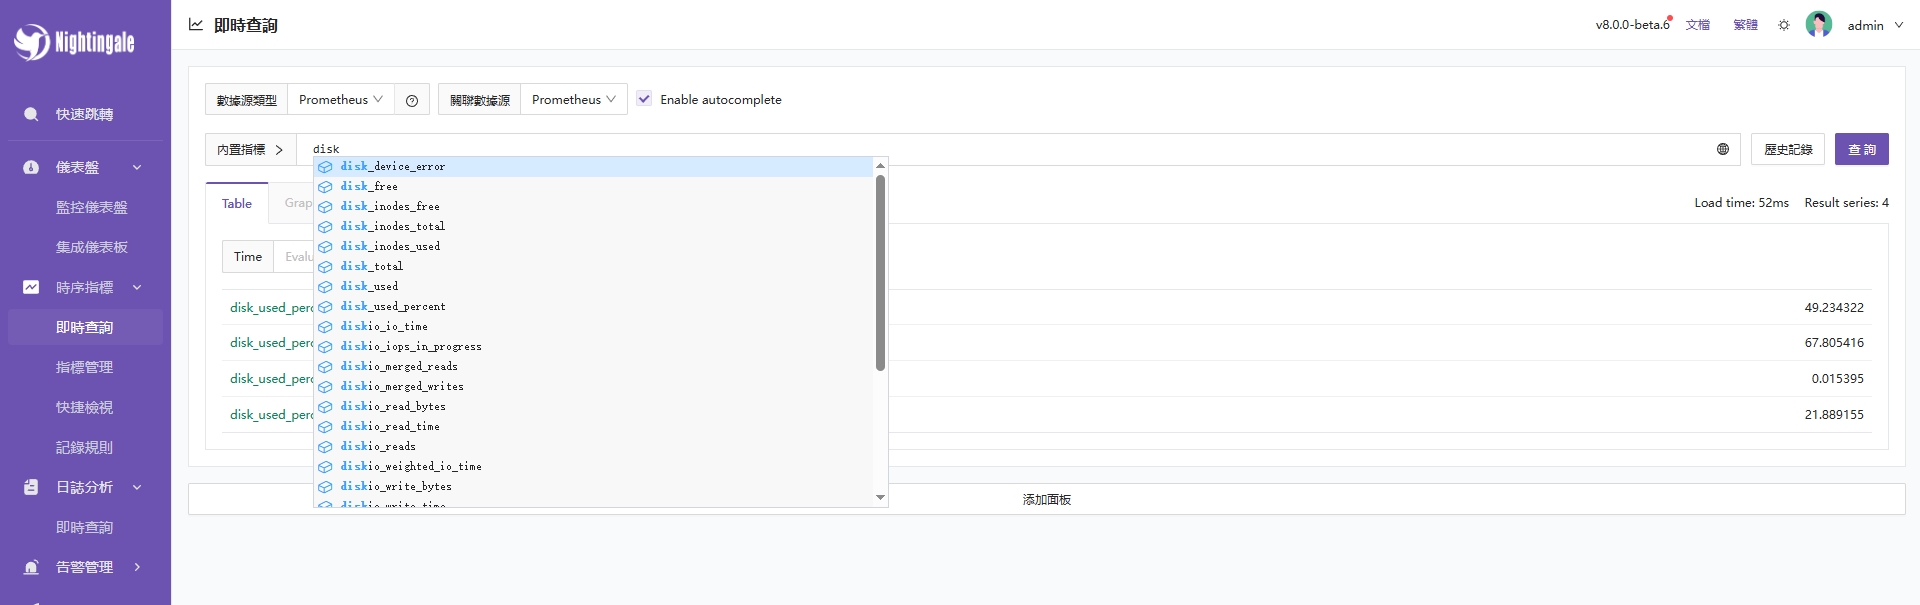
You can switch the language and theme in the upper right corner of the page. Currently we support English, Simplified Chinese, and Traditional Chinese.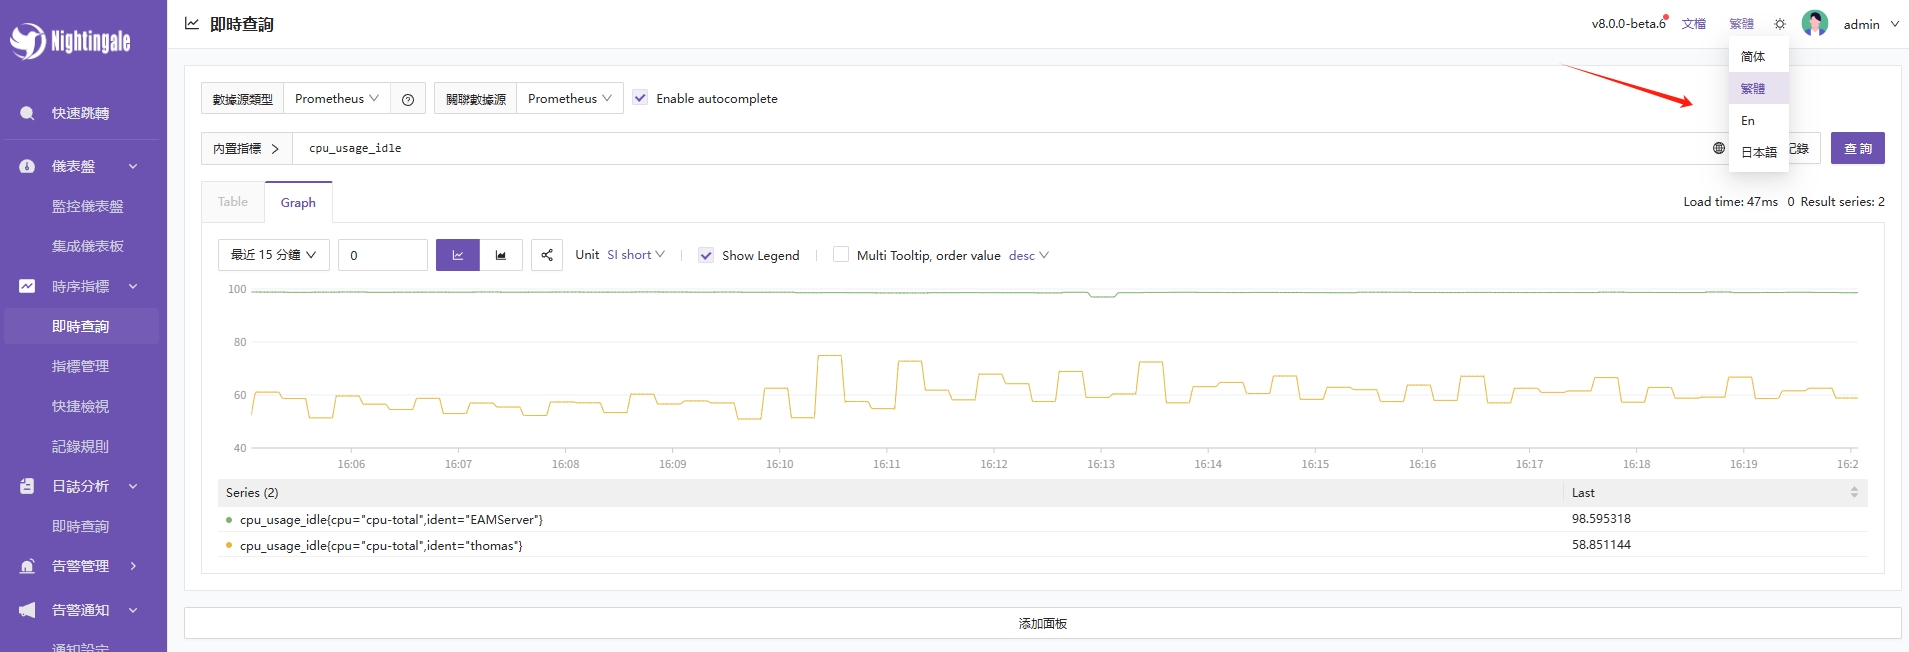 Instant query, similar to the query analysis page built into Prometheus, for ad-hoc query, Nightingale has made some UI optimizations and provided some built-in promql indicators, so that users who don't know much about promql can also query quickly.
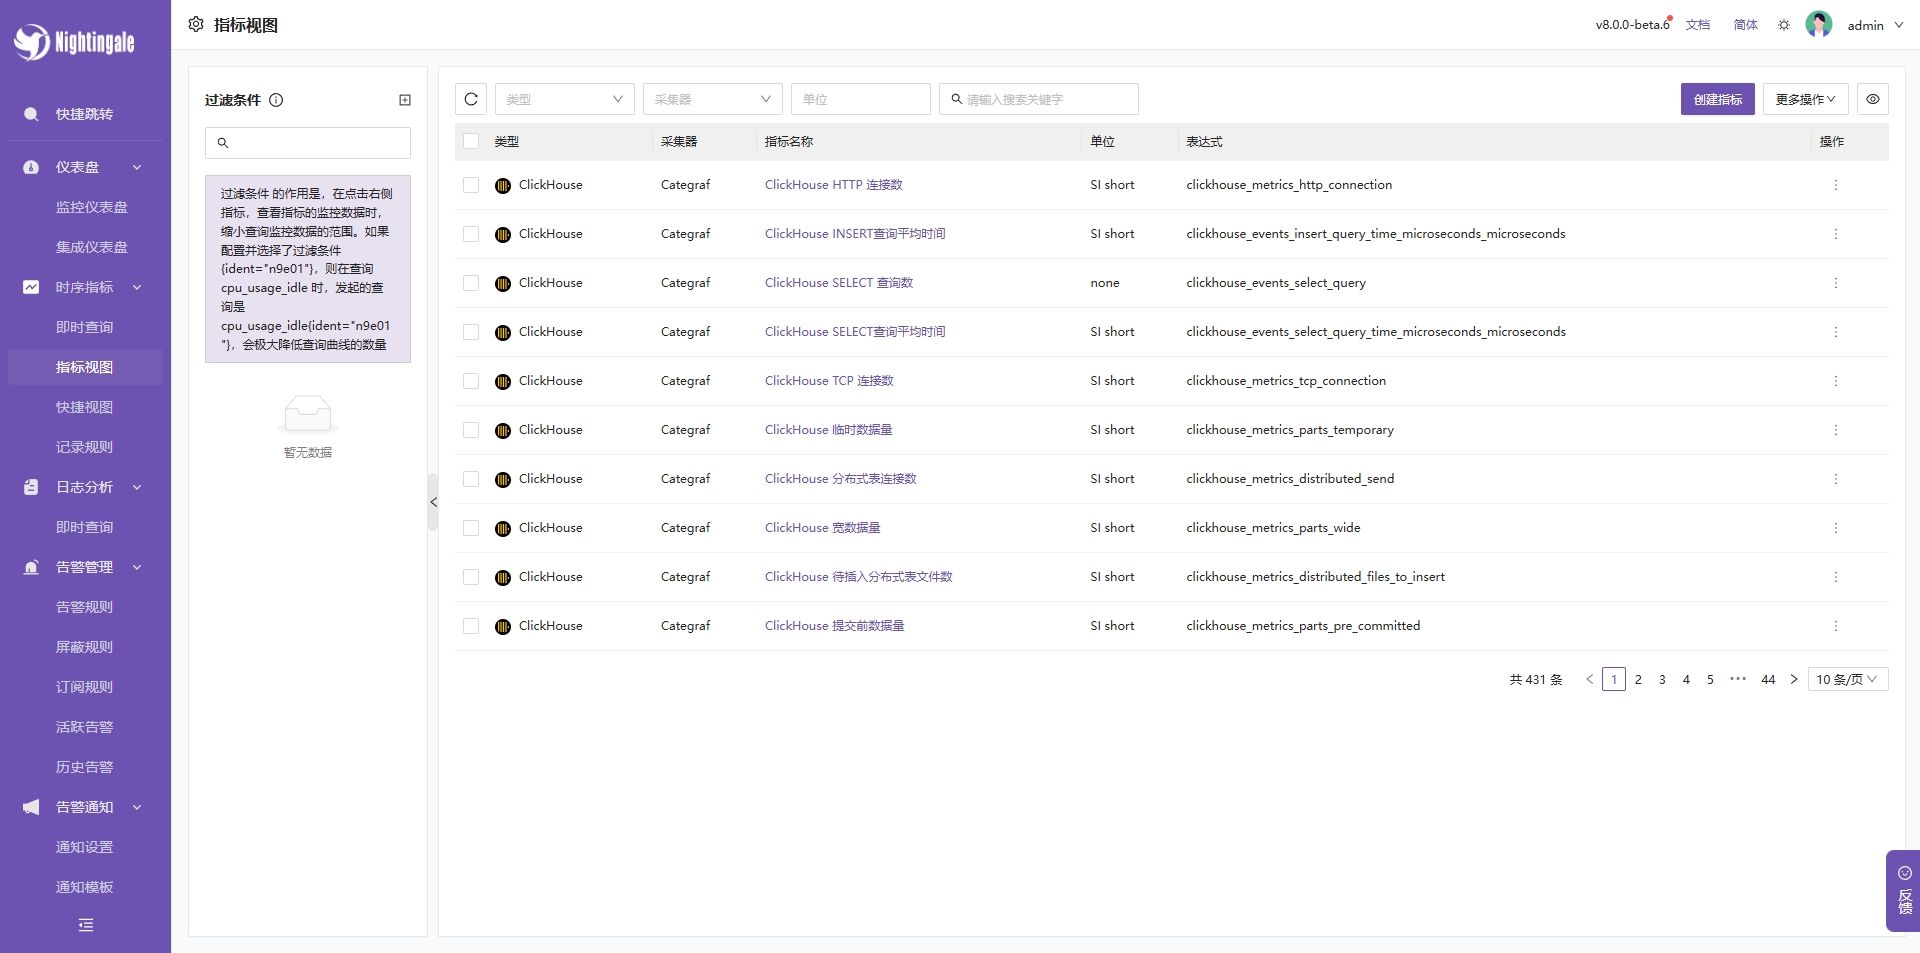
 Of course, you can also view it directly through the indicator view. With the indicator view, instant query is basically unnecessary, or only high-end players use instant query, and ordinary users can query directly through the indicator view.
 A variety of commonly used dashboards are built in, which can be directly imported and used.
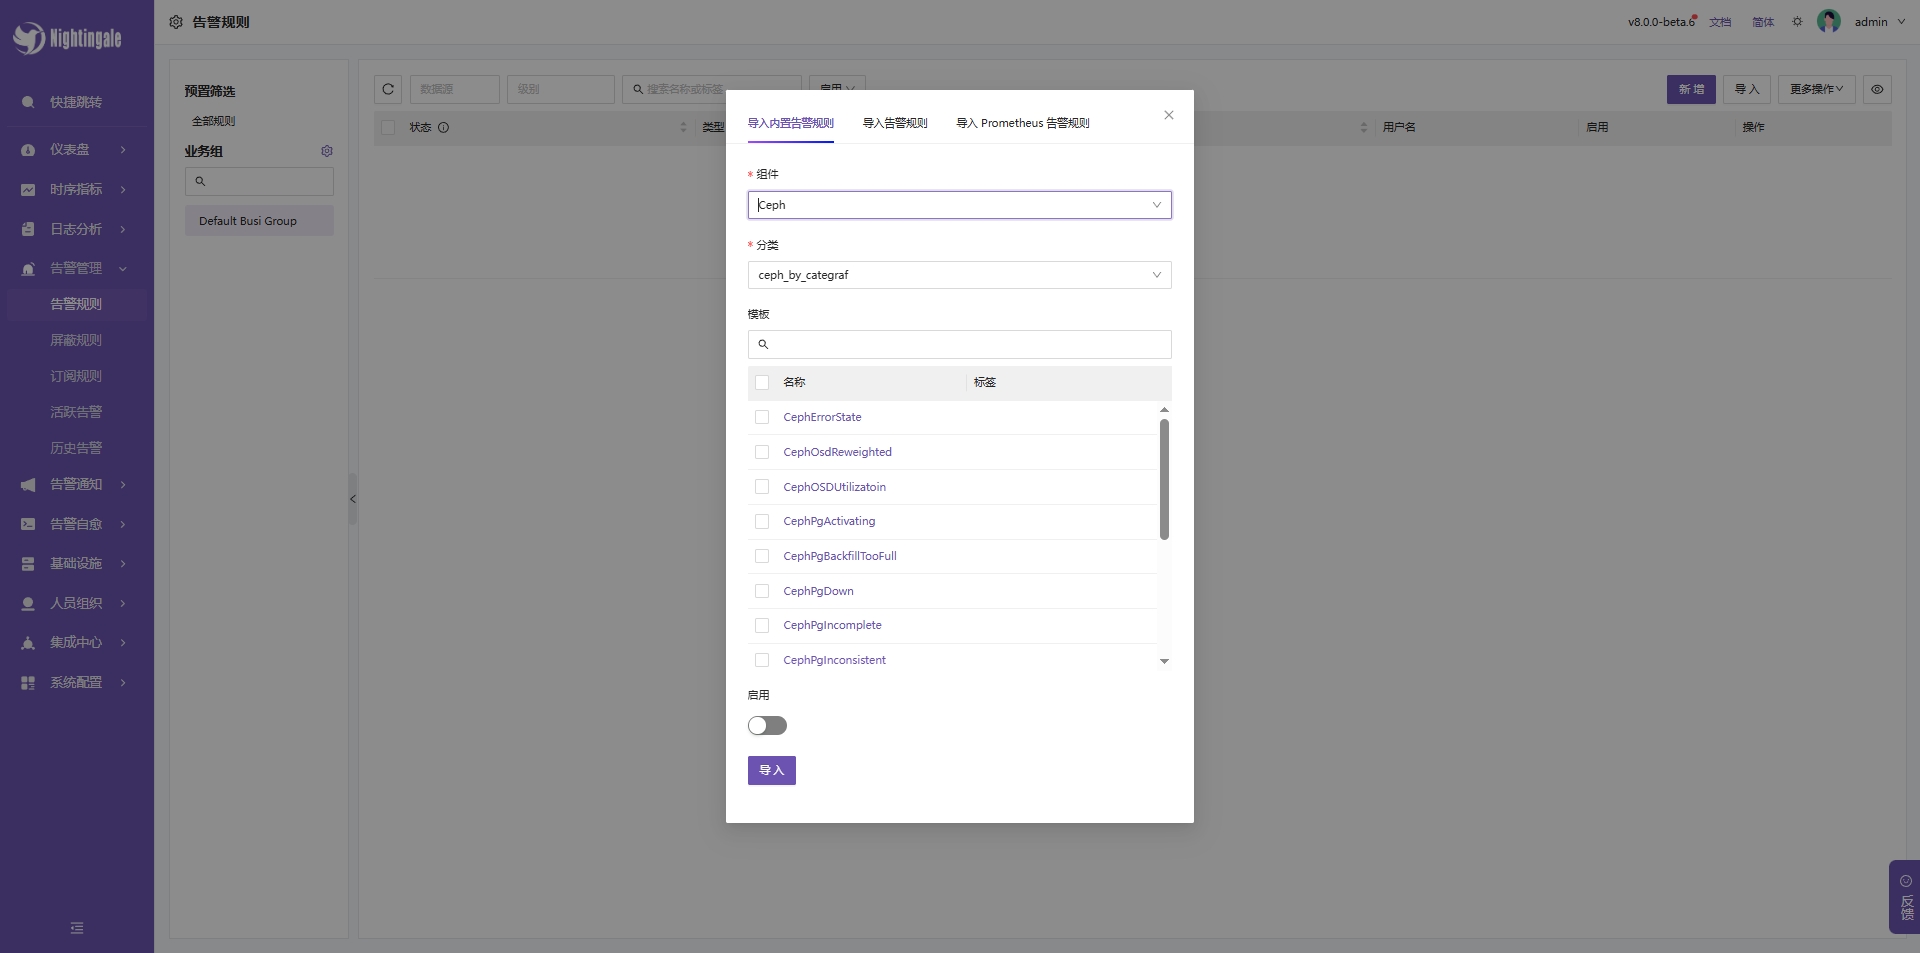
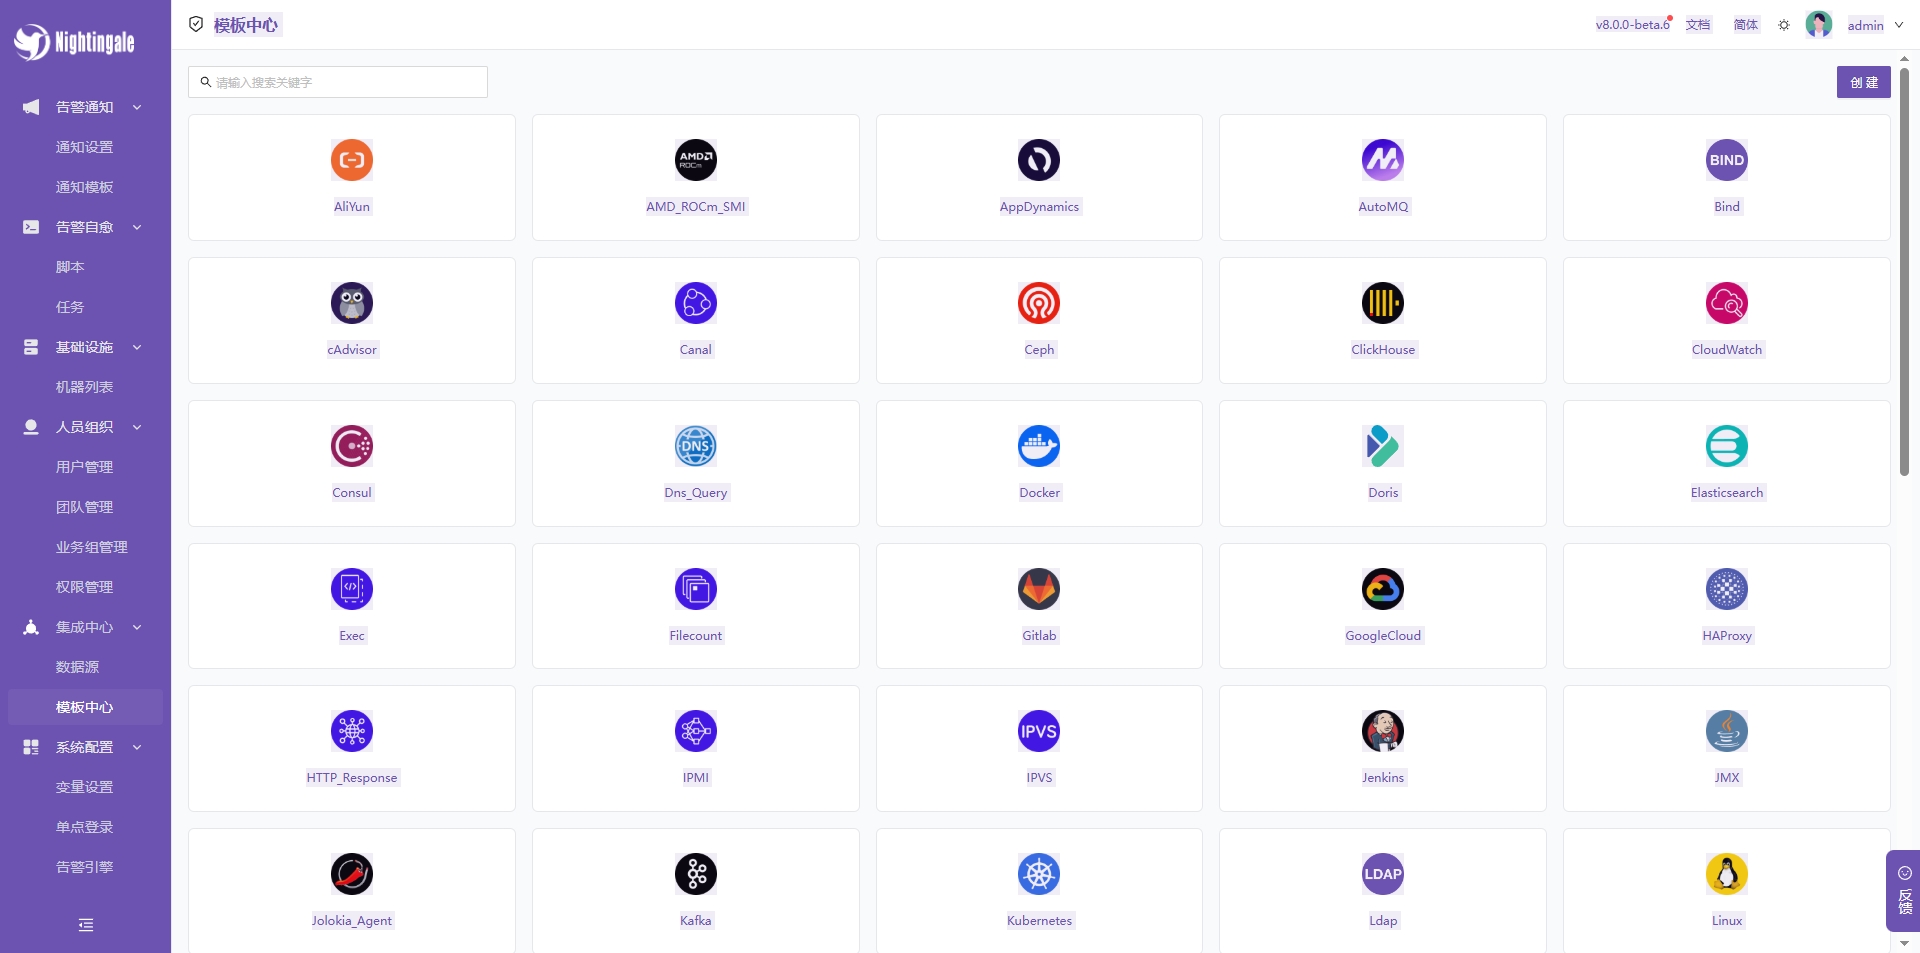 In addition to the built-in dashboard, many alarm rules are also built-in. You can import the rules that need alarms and use them out of the box.